Index Trend Analysis Report
Prepared for you on Friday, March 20, 2026.
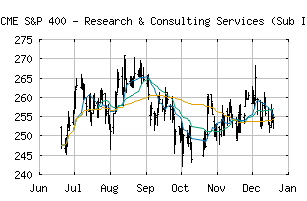
S&P 400 - Research & Consulting Services (Sub Ind) (CME:SP400-20202020)
Bear Market Rally (-75) - SP400-20202020 is showing some rallying power, but still remains in the confines of a long-term downtrend. Keep an eye on SP400-20202020 as it may be in the beginning of a reversal.
Is it time to buy, sell, or avoid SP400-20202020?
MarketClub looks at technical strength and momentum to determine if the timing is right for SP400-20202020.
Learn more about the Trade Triangles and how we make technical analysis as easy as buy and sell.
|
|||||||||||||||
|
|||||||||||||||
MarketClub’s Trade Triangles for SP400-20202020
![]() The long-term trend has been DOWN since Feb 3rd, 2026 at 247.69
The long-term trend has been DOWN since Feb 3rd, 2026 at 247.69
![]() The intermediate-term trend has been DOWN since Feb 2nd, 2026 at 254.18
The intermediate-term trend has been DOWN since Feb 2nd, 2026 at 254.18
![]() The short-term trend has been UP since Mar 18th, 2026 at 243.20
The short-term trend has been UP since Mar 18th, 2026 at 243.20
Smart Scan Analysis for SP400-20202020
Based on our trend formula, SP400-20202020 is rated as a -75 on a scale from -100 (Strong Downtrend) to +100 (Strong Uptrend).
| Open | High | Low | Price | Change |
|---|---|---|---|---|
| 239.34 | 243.86 | 238.71 | 241.21 | +0.31 |
| Prev. Close | Volume | Bid | Ask | Time |
| 241.21 | 0 | 2026-03-19 16:19:02 |
| 52wk High | 140.52 | 52wk High Date | 2018-09-14 |
| 52wk Low | 102.16 | 52wk Low Date | 2018-02-09 |