Index Trend Analysis Report
Prepared for you on Wednesday, March 18, 2026.
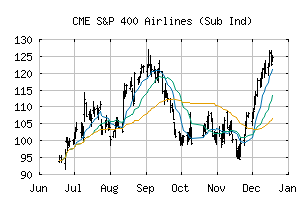
S&P 400 Airlines (Sub Ind) (CME:SP400-20302010)
Countertrend Down (-85) - SP400-20302010 is showing short-term strength. However, look for the longer-term bearish trend to resume. As always, continue to monitor the trend score and set stops.
Is it time to buy, sell, or avoid SP400-20302010?
MarketClub looks at technical strength and momentum to determine if the timing is right for SP400-20302010.
Learn more about the Trade Triangles and how we make technical analysis as easy as buy and sell.
|
|||||||||||||||
|
|||||||||||||||
MarketClub’s Trade Triangles for SP400-20302010
![]() The long-term trend has been DOWN since Mar 2nd, 2026 at 104.612
The long-term trend has been DOWN since Mar 2nd, 2026 at 104.612
![]() The intermediate-term trend has been DOWN since Feb 23rd, 2026 at 112.141
The intermediate-term trend has been DOWN since Feb 23rd, 2026 at 112.141
![]() The short-term trend has been UP since Mar 17th, 2026 at 89.720
The short-term trend has been UP since Mar 17th, 2026 at 89.720
Smart Scan Analysis for SP400-20302010
Based on our trend formula, SP400-20302010 is rated as a -85 on a scale from -100 (Strong Downtrend) to +100 (Strong Uptrend).
| Open | High | Low | Price | Change |
|---|---|---|---|---|
| 87.360 | 89.848 | 86.964 | 87.366 | -1.241 |
| Prev. Close | Volume | Bid | Ask | Time |
| 88.607 | 0 | 2026-03-18 16:18:33 |