Index Trend Analysis Report
Prepared for you on Thursday, December 26, 2024.
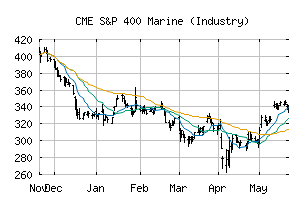
S&P 400 Marine (Industry) (CME:SP400-203030)
Strong Downtrend (-100) - SP400-203030 is in a strong downtrend that is likely to continue. With short-term, intermediate, and long-term bearish momentum, SP400-203030 continues to fall. Traders should use caution and set stops.
Is it time to buy, sell, or avoid SP400-203030?
MarketClub looks at technical strength and momentum to determine if the timing is right for SP400-203030.
Learn more about the Trade Triangles and how we make technical analysis as easy as buy and sell.
|
|||||||||||||||
|
|||||||||||||||
MarketClub’s Trade Triangles for SP400-203030
![]() The long-term trend has been DOWN since Dec 17th, 2024 at 347.28
The long-term trend has been DOWN since Dec 17th, 2024 at 347.28
![]() The intermediate-term trend has been DOWN since Dec 2nd, 2024 at 392.89
The intermediate-term trend has been DOWN since Dec 2nd, 2024 at 392.89
![]() The short-term trend has been DOWN since Nov 29th, 2024 at 394.24
The short-term trend has been DOWN since Nov 29th, 2024 at 394.24
Smart Scan Analysis for SP400-203030
Based on our trend formula, SP400-203030 is rated as a -100 on a scale from -100 (Strong Downtrend) to +100 (Strong Uptrend).
| Open | High | Low | Price | Change |
|---|---|---|---|---|
| 331.35 | 333.61 | 329.94 | 331.10 | -1.97 |
| Prev. Close | Volume | Bid | Ask | Time |
| 333.07 | 11994 | 2024-12-26 09:50:39 |
| 52wk High | 294.39 | 52wk High Date | 2018-06-05 |
| 52wk Low | 195.63 | 52wk Low Date | 2017-12-06 |