Index Trend Analysis Report
Prepared for you on Thursday, May 8, 2025.
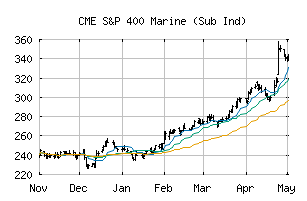
S&P 400 Marine (Sub Ind) (CME:SP400-20303010)
Crossroads (+60) - SP400-20303010 is struggling to move into a solid trend. Beware of choppy markets and consider a sidelines position until a stronger trend is identified.
Is it time to buy, sell, or avoid SP400-20303010?
MarketClub looks at technical strength and momentum to determine if the timing is right for SP400-20303010.
Learn more about the Trade Triangles and how we make technical analysis as easy as buy and sell.
|
|||||||||||||||
|
|||||||||||||||
MarketClub’s Trade Triangles for SP400-20303010
![]() The long-term trend has been DOWN since Dec 17th, 2024 at 347.28
The long-term trend has been DOWN since Dec 17th, 2024 at 347.28
![]() The intermediate-term trend has been UP since May 1st, 2025 at 311.32
The intermediate-term trend has been UP since May 1st, 2025 at 311.32
![]() The short-term trend has been UP since May 1st, 2025 at 305.23
The short-term trend has been UP since May 1st, 2025 at 305.23
Smart Scan Analysis for SP400-20303010
Based on our trend formula, SP400-20303010 is rated as a +60 on a scale from -100 (Strong Downtrend) to +100 (Strong Uptrend).
| Open | High | Low | Price | Change |
|---|---|---|---|---|
| 323.68 | 328.44 | 322.18 | 325.19 | +5.29 |
| Prev. Close | Volume | Bid | Ask | Time |
| 319.90 | 350024 | 2025-05-08 17:58:16 |
| 52wk High | 294.39 | 52wk High Date | 2018-06-05 |
| 52wk Low | 195.63 | 52wk Low Date | 2017-12-06 |