Index Trend Analysis Report
Prepared for you on Monday, April 6, 2026.
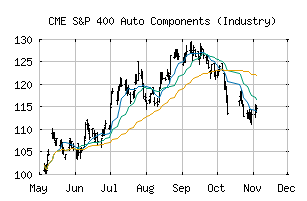
S&P 400 Auto Components (Industry) (CME:SP400-251010)
Sidelines Mode (-55) - SP400-251010 is moving in a sideways pattern and is unable to gain momentum in either direction. Beware of choppy movement and consider a sidelines position until a stronger trend is identified.
Is it time to buy, sell, or avoid SP400-251010?
MarketClub looks at technical strength and momentum to determine if the timing is right for SP400-251010.
Learn more about the Trade Triangles and how we make technical analysis as easy as buy and sell.
|
|||||||||||||||
|
|||||||||||||||
MarketClub’s Trade Triangles for SP400-251010
![]() The long-term trend has been DOWN since Mar 13th, 2026 at 114.00
The long-term trend has been DOWN since Mar 13th, 2026 at 114.00
![]() The intermediate-term trend has been DOWN since Mar 2nd, 2026 at 129.36
The intermediate-term trend has been DOWN since Mar 2nd, 2026 at 129.36
![]() The short-term trend has been UP since Apr 1st, 2026 at 119.76
The short-term trend has been UP since Apr 1st, 2026 at 119.76
Smart Scan Analysis for SP400-251010
Based on our trend formula, SP400-251010 is rated as a -55 on a scale from -100 (Strong Downtrend) to +100 (Strong Uptrend).
| Open | High | Low | Price | Change |
|---|---|---|---|---|
| 117.23 | 117.71 | 116.56 | 117.71 | +0.19 |
| Prev. Close | Volume | Bid | Ask | Time |
| 117.52 | 7613522 | 2026-04-06 16:20:05 |
| 52wk High | 238.43 | 52wk High Date | 2018-01-16 |
| 52wk Low | 118.56 | 52wk Low Date | 2018-11-12 |