Index Trend Analysis Report
Prepared for you on Tuesday, February 10, 2026.
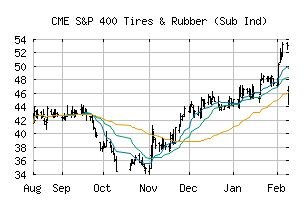
S&P 400 Tires & Rubber (Sub Ind) (CME:SP400-25101020)
Weak Downtrend (-65) - SP400-25101020 is showing signs of a strengthening downtrend. Monitor SP400-25101020 as it may be building momentum to the downside.
Is it time to buy, sell, or avoid SP400-25101020?
MarketClub looks at technical strength and momentum to determine if the timing is right for SP400-25101020.
Learn more about the Trade Triangles and how we make technical analysis as easy as buy and sell.
|
|||||||||||||||
|
|||||||||||||||
MarketClub’s Trade Triangles for SP400-25101020
![]() The long-term trend has been UP since Dec 3rd, 2025 at 44.37
The long-term trend has been UP since Dec 3rd, 2025 at 44.37
![]() The intermediate-term trend has been DOWN since Feb 10th, 2026 at 44.68
The intermediate-term trend has been DOWN since Feb 10th, 2026 at 44.68
![]() The short-term trend has been DOWN since Feb 10th, 2026 at 51.09
The short-term trend has been DOWN since Feb 10th, 2026 at 51.09
Smart Scan Analysis for SP400-25101020
Based on our trend formula, SP400-25101020 is rated as a -70 on a scale from -100 (Strong Downtrend) to +100 (Strong Uptrend).
| Open | High | Low | Price | Change |
|---|---|---|---|---|
| 46.46 | 47.02 | 44.38 | 45.98 | -7.18 |
| Prev. Close | Volume | Bid | Ask | Time |
| 53.16 | 23655801 | 2026-02-10 16:44:07 |