Index Trend Analysis Report
Prepared for you on Sunday, March 22, 2026.
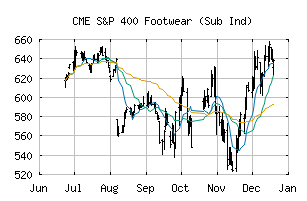
S&P 400 Footwear (Sub Ind) (CME:SP400-25203020)
Strong Downtrend (-100) - SP400-25203020 is in a strong downtrend that is likely to continue. With short-term, intermediate, and long-term bearish momentum, SP400-25203020 continues to fall. Traders should use caution and set stops.
Is it time to buy, sell, or avoid SP400-25203020?
MarketClub looks at technical strength and momentum to determine if the timing is right for SP400-25203020.
Learn more about the Trade Triangles and how we make technical analysis as easy as buy and sell.
|
|||||||||||||||
|
|||||||||||||||
MarketClub’s Trade Triangles for SP400-25203020
![]() The long-term trend has been DOWN since Mar 11th, 2026 at 578.82
The long-term trend has been DOWN since Mar 11th, 2026 at 578.82
![]() The intermediate-term trend has been DOWN since Mar 5th, 2026 at 590.68
The intermediate-term trend has been DOWN since Mar 5th, 2026 at 590.68
![]() The short-term trend has been DOWN since Mar 11th, 2026 at 588.43
The short-term trend has been DOWN since Mar 11th, 2026 at 588.43
Smart Scan Analysis for SP400-25203020
Based on our trend formula, SP400-25203020 is rated as a -100 on a scale from -100 (Strong Downtrend) to +100 (Strong Uptrend).
| Open | High | Low | Price | Change |
|---|---|---|---|---|
| 547.17 | 549.81 | 537.02 | 541.45 | -10.79 |
| Prev. Close | Volume | Bid | Ask | Time |
| 541.45 | 1365669 | 2026-03-20 16:19:50 |
| 52wk High | 192.03 | 52wk High Date | 2018-04-17 |
| 52wk Low | 142.4 | 52wk Low Date | 2018-10-11 |