Index Trend Analysis Report
Prepared for you on Monday, March 30, 2026.
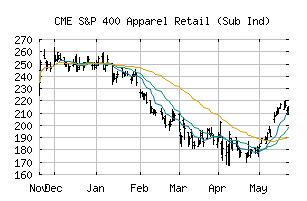
S&P 400 Apparel Retail (Sub Ind) (CME:SP400-25504010)
Crossroads (+60) - SP400-25504010 is struggling to move into a solid trend. Beware of choppy markets and consider a sidelines position until a stronger trend is identified.
Is it time to buy, sell, or avoid SP400-25504010?
MarketClub looks at technical strength and momentum to determine if the timing is right for SP400-25504010.
Learn more about the Trade Triangles and how we make technical analysis as easy as buy and sell.
|
|||||||||||||||
|
|||||||||||||||
MarketClub’s Trade Triangles for SP400-25504010
![]() The long-term trend has been UP since Jul 28th, 2025 at 220.55
The long-term trend has been UP since Jul 28th, 2025 at 220.55
![]() The intermediate-term trend has been DOWN since Mar 3rd, 2026 at 232.76
The intermediate-term trend has been DOWN since Mar 3rd, 2026 at 232.76
![]() The short-term trend has been DOWN since Mar 27th, 2026 at 237.23
The short-term trend has been DOWN since Mar 27th, 2026 at 237.23
Smart Scan Analysis for SP400-25504010
Based on our trend formula, SP400-25504010 is rated as a +60 on a scale from -100 (Strong Downtrend) to +100 (Strong Uptrend).
| Open | High | Low | Price | Change |
|---|---|---|---|---|
| 241.53 | 243.24 | 235.74 | 238.83 | -4.66 |
| Prev. Close | Volume | Bid | Ask | Time |
| 238.83 | 8540436 | 2026-03-27 16:34:13 |
| 52wk High | 360.96 | 52wk High Date | 2018-08-22 |
| 52wk Low | 197.84 | 52wk Low Date | 2017-12-01 |