Index Trend Analysis Report
Prepared for you on Saturday, April 4, 2026.
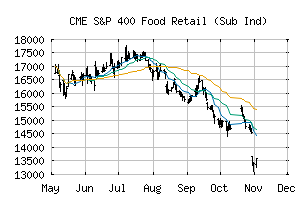
S&P 400 Food Retail (Sub Ind) (CME:SP400-30101030)
Strong Uptrend (+100) - SP400-30101030 is in a strong uptrend that is likely to continue. With short-term, intermediate, and long-term bullish momentum, SP400-30101030 continues to climb. Traders should protect gains and look for a change in score to suggest a slow down in momentum.
Is it time to buy, sell, or avoid SP400-30101030?
MarketClub looks at technical strength and momentum to determine if the timing is right for SP400-30101030.
Learn more about the Trade Triangles and how we make technical analysis as easy as buy and sell.
|
|||||||||||||||
|
|||||||||||||||
MarketClub’s Trade Triangles for SP400-30101030
![]() The long-term trend has been UP since Feb 24th, 2026 at 15261.69
The long-term trend has been UP since Feb 24th, 2026 at 15261.69
![]() The intermediate-term trend has been UP since Feb 13th, 2026 at 15094.85
The intermediate-term trend has been UP since Feb 13th, 2026 at 15094.85
![]() The short-term trend has been UP since Mar 25th, 2026 at 15605.90
The short-term trend has been UP since Mar 25th, 2026 at 15605.90
Smart Scan Analysis for SP400-30101030
Based on our trend formula, SP400-30101030 is rated as a +100 on a scale from -100 (Strong Downtrend) to +100 (Strong Uptrend).
| Open | High | Low | Price | Change |
|---|---|---|---|---|
| 16121.34 | 16308.61 | 15922.52 | 16281.80 | +194.73 |
| Prev. Close | Volume | Bid | Ask | Time |
| 16281.80 | 10862698 | 2026-04-02 16:19:05 |
| 52wk High | 5431.96 | 52wk High Date | 2018-09-11 |
| 52wk Low | 3893.33 | 52wk Low Date | 2018-06-12 |