Index Trend Analysis Report
Prepared for you on Saturday, March 14, 2026.
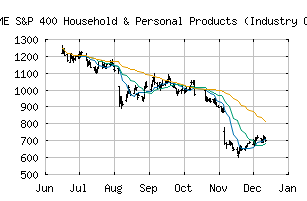
S&P 400 Household & Personal Products (Industry Group) (CME:SP400-3030)
Long-Term Downtrend (-90) - SP400-3030 is in a strong downtrend that is likely to continue. While SP400-3030 is showing intraday strength, it remains in the confines of a bearish trend. Traders should use caution and set stops.
Is it time to buy, sell, or avoid SP400-3030?
MarketClub looks at technical strength and momentum to determine if the timing is right for SP400-3030.
Learn more about the Trade Triangles and how we make technical analysis as easy as buy and sell.
|
|||||||||||||||
|
|||||||||||||||
MarketClub’s Trade Triangles for SP400-3030
![]() The long-term trend has been DOWN since Aug 5th, 2025 at 969.89
The long-term trend has been DOWN since Aug 5th, 2025 at 969.89
![]() The intermediate-term trend has been DOWN since Feb 3rd, 2026 at 643.49
The intermediate-term trend has been DOWN since Feb 3rd, 2026 at 643.49
![]() The short-term trend has been DOWN since Mar 2nd, 2026 at 617.01
The short-term trend has been DOWN since Mar 2nd, 2026 at 617.01
Smart Scan Analysis for SP400-3030
Based on our trend formula, SP400-3030 is rated as a -90 on a scale from -100 (Strong Downtrend) to +100 (Strong Uptrend).
| Open | High | Low | Price | Change |
|---|---|---|---|---|
| 520.62 | 533.84 | 518.12 | 523.55 | +4.44 |
| Prev. Close | Volume | Bid | Ask | Time |
| 523.55 | 12387254 | 2026-03-13 16:19:35 |
| 52wk High | 1370.08 | 52wk High Date | 2018-08-03 |
| 52wk Low | 1007.66 | 52wk Low Date | 2018-11-29 |