Index Trend Analysis Report
Prepared for you on Friday, December 19, 2025.
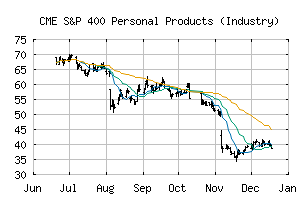
S&P 400 Personal Products (Industry) (CME:SP400-303020)
Bear Market Rally (-75) - SP400-303020 is showing some rallying power, but still remains in the confines of a long-term downtrend. Keep an eye on SP400-303020 as it may be in the beginning of a reversal.
Is it time to buy, sell, or avoid SP400-303020?
MarketClub looks at technical strength and momentum to determine if the timing is right for SP400-303020.
Learn more about the Trade Triangles and how we make technical analysis as easy as buy and sell.
|
|||||||||||||||
|
|||||||||||||||
MarketClub’s Trade Triangles for SP400-303020
![]() The long-term trend has been DOWN since Aug 5th, 2025 at 55.34
The long-term trend has been DOWN since Aug 5th, 2025 at 55.34
![]() The intermediate-term trend has been UP since Dec 1st, 2025 at 40.09
The intermediate-term trend has been UP since Dec 1st, 2025 at 40.09
![]() The short-term trend has been DOWN since Dec 10th, 2025 at 39.44
The short-term trend has been DOWN since Dec 10th, 2025 at 39.44
Smart Scan Analysis for SP400-303020
Based on our trend formula, SP400-303020 is rated as a -75 on a scale from -100 (Strong Downtrend) to +100 (Strong Uptrend).
| Open | High | Low | Price | Change |
|---|---|---|---|---|
| 39.91 | 40.15 | 38.57 | 38.76 | -0.76 |
| Prev. Close | Volume | Bid | Ask | Time |
| 38.76 | 9995213 | 2025-12-18 16:48:55 |
| 52wk High | 63.87 | 52wk High Date | 2018-08-03 |
| 52wk Low | 47.85 | 52wk Low Date | 2018-11-21 |