Index Trend Analysis Report
Prepared for you on Sunday, June 1, 2025.
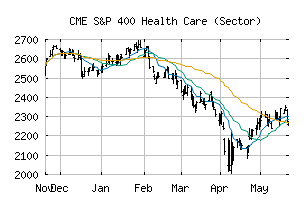
S&P 400 Health Care (Sector) (CME:SP400-35)
Sidelines Mode (+55) - SP400-35 is moving in a sideways pattern and is unable to gain momentum in either direction. Beware of choppy movement and consider a sidelines position until a stronger trend is identified.
Is it time to buy, sell, or avoid SP400-35?
MarketClub looks at technical strength and momentum to determine if the timing is right for SP400-35.
Learn more about the Trade Triangles and how we make technical analysis as easy as buy and sell.
|
|||||||||||||||
|
|||||||||||||||
MarketClub’s Trade Triangles for SP400-35
![]() The long-term trend has been DOWN since Nov 15th, 2024 at 2506.84
The long-term trend has been DOWN since Nov 15th, 2024 at 2506.84
![]() The intermediate-term trend has been UP since Apr 28th, 2025 at 2238.68
The intermediate-term trend has been UP since Apr 28th, 2025 at 2238.68
![]() The short-term trend has been DOWN since May 30th, 2025 at 2272.93
The short-term trend has been DOWN since May 30th, 2025 at 2272.93
Smart Scan Analysis for SP400-35
Based on our trend formula, SP400-35 is rated as a +55 on a scale from -100 (Strong Downtrend) to +100 (Strong Uptrend).
| Open | High | Low | Price | Change |
|---|---|---|---|---|
| 2288.08 | 2309.36 | 2266.14 | 2300.80 | +3.98 |
| Prev. Close | Volume | Bid | Ask | Time |
| 2300.80 | 106410369 | 2025-05-30 16:19:54 |
| 52wk High | 2133.25 | 52wk High Date | 2018-09-14 |
| 52wk Low | 1552.84 | 52wk Low Date | 2017-12-06 |