Index Trend Analysis Report
Prepared for you on Saturday, April 4, 2026.
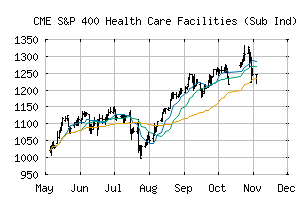
S&P 400 Health Care Facilities (Sub Ind) (CME:SP400-35102020)
Crossroads (-60) - SP400-35102020 is struggling to move into a solid trend. Beware of choppy markets and consider a sidelines position until a stronger trend is identified.
Is it time to buy, sell, or avoid SP400-35102020?
MarketClub looks at technical strength and momentum to determine if the timing is right for SP400-35102020.
Learn more about the Trade Triangles and how we make technical analysis as easy as buy and sell.
|
|||||||||||||||
|
|||||||||||||||
MarketClub’s Trade Triangles for SP400-35102020
![]() The long-term trend has been UP since Feb 11th, 2026 at 1310.57
The long-term trend has been UP since Feb 11th, 2026 at 1310.57
![]() The intermediate-term trend has been DOWN since Mar 12th, 2026 at 1322.52
The intermediate-term trend has been DOWN since Mar 12th, 2026 at 1322.52
![]() The short-term trend has been DOWN since Mar 9th, 2026 at 1333.48
The short-term trend has been DOWN since Mar 9th, 2026 at 1333.48
Smart Scan Analysis for SP400-35102020
Based on our trend formula, SP400-35102020 is rated as a -60 on a scale from -100 (Strong Downtrend) to +100 (Strong Uptrend).
| Open | High | Low | Price | Change |
|---|---|---|---|---|
| 1170.48 | 1182.15 | 1151.60 | 1174.05 | -11.97 |
| Prev. Close | Volume | Bid | Ask | Time |
| 1174.05 | 1594463 | 2026-04-02 16:19:05 |
| 52wk High | 495.56 | 52wk High Date | 2018-08-06 |
| 52wk Low | 297.48 | 52wk Low Date | 2017-12-06 |