Index Trend Analysis Report
Prepared for you on Thursday, April 2, 2026.
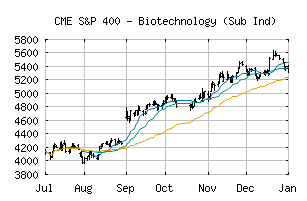
S&P 400 - Biotechnology (Sub Ind) (CME:SP400-35201010)
Strong Uptrend (+100) - SP400-35201010 is in a strong uptrend that is likely to continue. With short-term, intermediate, and long-term bullish momentum, SP400-35201010 continues to climb. Traders should protect gains and look for a change in score to suggest a slow down in momentum.
Is it time to buy, sell, or avoid SP400-35201010?
MarketClub looks at technical strength and momentum to determine if the timing is right for SP400-35201010.
Learn more about the Trade Triangles and how we make technical analysis as easy as buy and sell.
|
|||||||||||||||
|
|||||||||||||||
MarketClub’s Trade Triangles for SP400-35201010
![]() The long-term trend has been UP since Sep 2nd, 2025 at 4332.20
The long-term trend has been UP since Sep 2nd, 2025 at 4332.20
![]() The intermediate-term trend has been UP since Mar 31st, 2026 at 5661.02
The intermediate-term trend has been UP since Mar 31st, 2026 at 5661.02
![]() The short-term trend has been UP since Mar 25th, 2026 at 5461.12
The short-term trend has been UP since Mar 25th, 2026 at 5461.12
Smart Scan Analysis for SP400-35201010
Based on our trend formula, SP400-35201010 is rated as a +100 on a scale from -100 (Strong Downtrend) to +100 (Strong Uptrend).
| Open | High | Low | Price | Change |
|---|---|---|---|---|
| 5575.42 | 5687.67 | 5556.10 | 5623.17 | -49.07 |
| Prev. Close | Volume | Bid | Ask | Time |
| 5672.24 | 15733189 | 2026-04-02 16:19:05 |
| 52wk High | 4895.56 | 52wk High Date | 2018-08-02 |
| 52wk Low | 2951.99 | 52wk Low Date | 2017-12-01 |