Index Trend Analysis Report
Prepared for you on Monday, March 23, 2026.
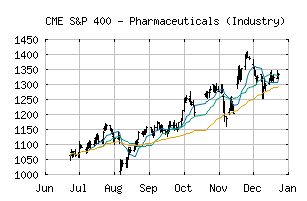
S&P 400 - Pharmaceuticals (Industry) (CME:SP400-352020)
Crossroads (-60) - SP400-352020 is struggling to move into a solid trend. Beware of choppy markets and consider a sidelines position until a stronger trend is identified.
Is it time to buy, sell, or avoid SP400-352020?
MarketClub looks at technical strength and momentum to determine if the timing is right for SP400-352020.
Learn more about the Trade Triangles and how we make technical analysis as easy as buy and sell.
|
|||||||||||||||
|
|||||||||||||||
MarketClub’s Trade Triangles for SP400-352020
![]() The long-term trend has been UP since Sep 8th, 2025 at 1170.58
The long-term trend has been UP since Sep 8th, 2025 at 1170.58
![]() The intermediate-term trend has been DOWN since Mar 12th, 2026 at 1384.40
The intermediate-term trend has been DOWN since Mar 12th, 2026 at 1384.40
![]() The short-term trend has been DOWN since Mar 20th, 2026 at 1425.18
The short-term trend has been DOWN since Mar 20th, 2026 at 1425.18
Smart Scan Analysis for SP400-352020
Based on our trend formula, SP400-352020 is rated as a -60 on a scale from -100 (Strong Downtrend) to +100 (Strong Uptrend).
| Open | High | Low | Price | Change |
|---|---|---|---|---|
| 1455.60 | 1472.57 | 1440.37 | 1449.41 | +20.71 |
| Prev. Close | Volume | Bid | Ask | Time |
| 1428.70 | 5093037 | 2026-03-23 16:19:50 |
| 52wk High | 1546.07 | 52wk High Date | 2018-01-26 |
| 52wk Low | 1017.02 | 52wk Low Date | 2018-05-03 |