Index Trend Analysis Report
Prepared for you on Tuesday, March 24, 2026.
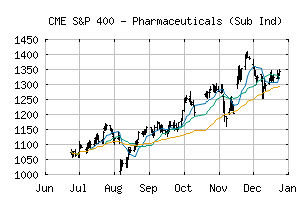
S&P 400 - Pharmaceuticals (Sub Ind) (CME:SP400-35202010)
Weak Uptrend (+65) - SP400-35202010 is showing signs of weakening momentum to the upside. Monitor SP400-35202010 as it may be in the beginning stages of a reversal.
Is it time to buy, sell, or avoid SP400-35202010?
MarketClub looks at technical strength and momentum to determine if the timing is right for SP400-35202010.
Learn more about the Trade Triangles and how we make technical analysis as easy as buy and sell.
|
|||||||||||||||
|
|||||||||||||||
MarketClub’s Trade Triangles for SP400-35202010
![]() The long-term trend has been UP since Sep 8th, 2025 at 1170.58
The long-term trend has been UP since Sep 8th, 2025 at 1170.58
![]() The intermediate-term trend has been DOWN since Mar 12th, 2026 at 1384.40
The intermediate-term trend has been DOWN since Mar 12th, 2026 at 1384.40
![]() The short-term trend has been UP since Mar 24th, 2026 at 1483.98
The short-term trend has been UP since Mar 24th, 2026 at 1483.98
Smart Scan Analysis for SP400-35202010
Based on our trend formula, SP400-35202010 is rated as a +65 on a scale from -100 (Strong Downtrend) to +100 (Strong Uptrend).
| Open | High | Low | Price | Change |
|---|---|---|---|---|
| 1435.56 | 1485.35 | 1434.26 | 1473.88 | +24.47 |
| Prev. Close | Volume | Bid | Ask | Time |
| 1449.41 | 9243689 | 2026-03-24 16:20:05 |
| 52wk High | 1546.07 | 52wk High Date | 2018-01-26 |
| 52wk Low | 1017.02 | 52wk Low Date | 2018-05-03 |