Index Trend Analysis Report
Prepared for you on Sunday, February 1, 2026.
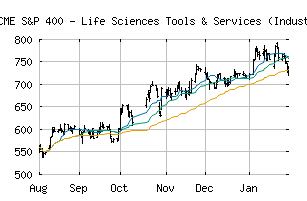
S&P 400 - Life Sciences Tools & Services (Industry) (CME:SP400-352030)
Crossroads (-60) - SP400-352030 is struggling to move into a solid trend. Beware of choppy markets and consider a sidelines position until a stronger trend is identified.
Is it time to buy, sell, or avoid SP400-352030?
MarketClub looks at technical strength and momentum to determine if the timing is right for SP400-352030.
Learn more about the Trade Triangles and how we make technical analysis as easy as buy and sell.
|
|||||||||||||||
|
|||||||||||||||
MarketClub’s Trade Triangles for SP400-352030
![]() The long-term trend has been UP since Jul 1st, 2025 at 554.39
The long-term trend has been UP since Jul 1st, 2025 at 554.39
![]() The intermediate-term trend has been DOWN since Jan 30th, 2026 at 721.59
The intermediate-term trend has been DOWN since Jan 30th, 2026 at 721.59
![]() The short-term trend has been DOWN since Jan 26th, 2026 at 753.74
The short-term trend has been DOWN since Jan 26th, 2026 at 753.74
Smart Scan Analysis for SP400-352030
Based on our trend formula, SP400-352030 is rated as a -60 on a scale from -100 (Strong Downtrend) to +100 (Strong Uptrend).
| Open | High | Low | Price | Change |
|---|---|---|---|---|
| 734.72 | 740.74 | 719.64 | 724.96 | -15.00 |
| Prev. Close | Volume | Bid | Ask | Time |
| 724.96 | 17687846 | 2026-01-30 16:20:05 |
| 52wk High | 396.85 | 52wk High Date | 2018-10-01 |
| 52wk Low | 271.22 | 52wk Low Date | 2018-02-09 |