Index Trend Analysis Report
Prepared for you on Friday, May 9, 2025.
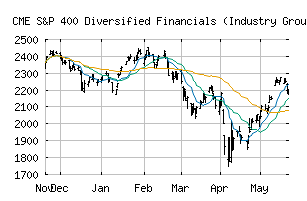
S&P 400 Diversified Financials (Industry Group) (CME:SP400-4020)
Crossroads (+60) - SP400-4020 is struggling to move into a solid trend. Beware of choppy markets and consider a sidelines position until a stronger trend is identified.
Is it time to buy, sell, or avoid SP400-4020?
MarketClub looks at technical strength and momentum to determine if the timing is right for SP400-4020.
Learn more about the Trade Triangles and how we make technical analysis as easy as buy and sell.
|
|||||||||||||||
|
|||||||||||||||
MarketClub’s Trade Triangles for SP400-4020
![]() The long-term trend has been DOWN since Mar 4th, 2025 at 2175.45
The long-term trend has been DOWN since Mar 4th, 2025 at 2175.45
![]() The intermediate-term trend has been UP since Apr 28th, 2025 at 2029.39
The intermediate-term trend has been UP since Apr 28th, 2025 at 2029.39
![]() The short-term trend has been UP since May 1st, 2025 at 2056.38
The short-term trend has been UP since May 1st, 2025 at 2056.38
Smart Scan Analysis for SP400-4020
Based on our trend formula, SP400-4020 is rated as a +60 on a scale from -100 (Strong Downtrend) to +100 (Strong Uptrend).
| Open | High | Low | Price | Change |
|---|---|---|---|---|
| 2129.22 | 2167.70 | 2123.93 | 2144.62 | +47.27 |
| Prev. Close | Volume | Bid | Ask | Time |
| 2144.62 | 42723894 | 2025-05-08 17:58:16 |
| 52wk High | 1311.41 | 52wk High Date | 2018-03-13 |
| 52wk Low | 1004.77 | 52wk Low Date | 2018-10-24 |