Index Trend Analysis Report
Prepared for you on Friday, July 26, 2024.
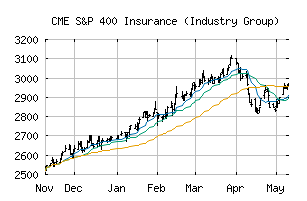
S&P 400 Insurance (Industry Group) (CME:SP400-4030)
Bull Market Weakness (+75) - SP400-4030 is showing signs of short-term weakness, but still remains in the confines of a long-term uptrend. Keep an eye on SP400-4030 as it may be in the beginning stages of a reversal.
Is it time to buy, sell, or avoid SP400-4030?
MarketClub looks at technical strength and momentum to determine if the timing is right for SP400-4030.
Learn more about the Trade Triangles and how we make technical analysis as easy as buy and sell.
|
|||||||||||||||
|
|||||||||||||||
MarketClub’s Trade Triangles for SP400-4030
![]() The long-term trend has been DOWN since Jun 13th, 2024 at 2814.24
The long-term trend has been DOWN since Jun 13th, 2024 at 2814.24
![]() The intermediate-term trend has been UP since Jul 12th, 2024 at 2910.24
The intermediate-term trend has been UP since Jul 12th, 2024 at 2910.24
![]() The short-term trend has been UP since Jul 24th, 2024 at 3003.15
The short-term trend has been UP since Jul 24th, 2024 at 3003.15
Smart Scan Analysis for SP400-4030
Based on our trend formula, SP400-4030 is rated as a +70 on a scale from -100 (Strong Downtrend) to +100 (Strong Uptrend).
| Open | High | Low | Price | Change |
|---|---|---|---|---|
| 3003.36 | 3084.58 | 2988.18 | 3083.42 | +99.91 |
| Prev. Close | Volume | Bid | Ask | Time |
| 2983.51 | 9156991 | 2024-07-26 16:20:05 |
| 52wk High | 1812.96 | 52wk High Date | 2018-09-06 |
| 52wk Low | 1576.77 | 52wk Low Date | 2018-02-09 |