Index Trend Analysis Report
Prepared for you on Friday, July 11, 2025.
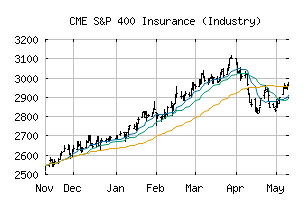
S&P 400 Insurance (Industry) (CME:SP400-403010)
Strong Downtrend (-100) - SP400-403010 is in a strong downtrend that is likely to continue. With short-term, intermediate, and long-term bearish momentum, SP400-403010 continues to fall. Traders should use caution and set stops.
Is it time to buy, sell, or avoid SP400-403010?
MarketClub looks at technical strength and momentum to determine if the timing is right for SP400-403010.
Learn more about the Trade Triangles and how we make technical analysis as easy as buy and sell.
|
|||||||||||||||
|
|||||||||||||||
MarketClub’s Trade Triangles for SP400-403010
![]() The long-term trend has been DOWN since Apr 4th, 2025 at 3231.34
The long-term trend has been DOWN since Apr 4th, 2025 at 3231.34
![]() The intermediate-term trend has been DOWN since Jul 10th, 2025 at 3273.77
The intermediate-term trend has been DOWN since Jul 10th, 2025 at 3273.77
![]() The short-term trend has been DOWN since Jul 2nd, 2025 at 3347.18
The short-term trend has been DOWN since Jul 2nd, 2025 at 3347.18
Smart Scan Analysis for SP400-403010
Based on our trend formula, SP400-403010 is rated as a -100 on a scale from -100 (Strong Downtrend) to +100 (Strong Uptrend).
| Open | High | Low | Price | Change |
|---|---|---|---|---|
| 3327.14 | 3331.51 | 3273.07 | 3294.64 | -41.61 |
| Prev. Close | Volume | Bid | Ask | Time |
| 3294.64 | 22581565 | 2025-07-10 16:52:28 |
| 52wk High | 1812.96 | 52wk High Date | 2018-09-06 |
| 52wk Low | 1576.77 | 52wk Low Date | 2018-02-09 |