Index Trend Analysis Report
Prepared for you on Friday, July 26, 2024.
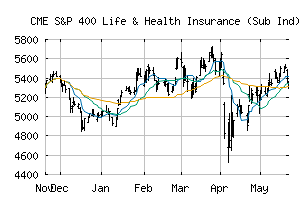
S&P 400 Life & Health Insurance (Sub Ind) (CME:SP400-40301020)
Strong Uptrend (+100) - SP400-40301020 is in a strong uptrend that is likely to continue. With short-term, intermediate, and long-term bullish momentum, SP400-40301020 continues to climb. Traders should protect gains and look for a change in score to suggest a slow down in momentum.
Is it time to buy, sell, or avoid SP400-40301020?
MarketClub looks at technical strength and momentum to determine if the timing is right for SP400-40301020.
Learn more about the Trade Triangles and how we make technical analysis as easy as buy and sell.
|
|||||||||||||||
|
|||||||||||||||
MarketClub’s Trade Triangles for SP400-40301020
![]() The long-term trend has been UP since Jul 16th, 2024 at 4199.45
The long-term trend has been UP since Jul 16th, 2024 at 4199.45
![]() The intermediate-term trend has been UP since Jul 1st, 2024 at 3956.27
The intermediate-term trend has been UP since Jul 1st, 2024 at 3956.27
![]() The short-term trend has been UP since Jul 10th, 2024 at 3933.64
The short-term trend has been UP since Jul 10th, 2024 at 3933.64
Smart Scan Analysis for SP400-40301020
Based on our trend formula, SP400-40301020 is rated as a +100 on a scale from -100 (Strong Downtrend) to +100 (Strong Uptrend).
| Open | High | Low | Price | Change |
|---|---|---|---|---|
| 4189.18 | 4212.63 | 4183.43 | 4194.73 | +14.50 |
| Prev. Close | Volume | Bid | Ask | Time |
| 4180.23 | 2037765 | 2024-07-26 16:20:09 |
| 52wk High | 2364.5 | 52wk High Date | 2018-09-14 |
| 52wk Low | 1788.49 | 52wk Low Date | 2018-05-03 |