Index Trend Analysis Report
Prepared for you on Friday, August 29, 2025.
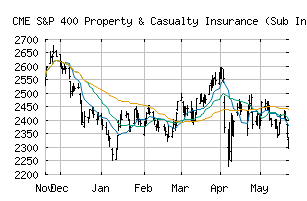
S&P 400 Property & Casualty Insurance (Sub Ind) (CME:SP400-40301040)
Crossroads (+60) - SP400-40301040 is struggling to move into a solid trend. Beware of choppy markets and consider a sidelines position until a stronger trend is identified.
Is it time to buy, sell, or avoid SP400-40301040?
MarketClub looks at technical strength and momentum to determine if the timing is right for SP400-40301040.
Learn more about the Trade Triangles and how we make technical analysis as easy as buy and sell.
|
|||||||||||||||
|
|||||||||||||||
MarketClub’s Trade Triangles for SP400-40301040
![]() The long-term trend has been DOWN since Apr 7th, 2025 at 2252.89
The long-term trend has been DOWN since Apr 7th, 2025 at 2252.89
![]() The intermediate-term trend has been UP since Aug 13th, 2025 at 2382.29
The intermediate-term trend has been UP since Aug 13th, 2025 at 2382.29
![]() The short-term trend has been UP since Aug 20th, 2025 at 2410.59
The short-term trend has been UP since Aug 20th, 2025 at 2410.59
Smart Scan Analysis for SP400-40301040
Based on our trend formula, SP400-40301040 is rated as a +60 on a scale from -100 (Strong Downtrend) to +100 (Strong Uptrend).
| Open | High | Low | Price | Change |
|---|---|---|---|---|
| 2419.81 | 2435.28 | 2413.21 | 2419.94 | +6.99 |
| Prev. Close | Volume | Bid | Ask | Time |
| 2412.95 | 4748681 | 2025-08-29 16:19:09 |
| 52wk High | 1523.16 | 52wk High Date | 2018-09-06 |
| 52wk Low | 1307.98 | 52wk Low Date | 2018-02-09 |