Index Trend Analysis Report
Prepared for you on Wednesday, April 8, 2026.
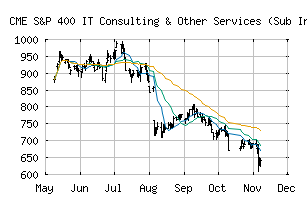
S&P 400 IT Consulting & Other Services (Sub Ind) (CME:SP400-45102010)
Crossroads (+60) - SP400-45102010 is struggling to move into a solid trend. Beware of choppy markets and consider a sidelines position until a stronger trend is identified.
Is it time to buy, sell, or avoid SP400-45102010?
MarketClub looks at technical strength and momentum to determine if the timing is right for SP400-45102010.
Learn more about the Trade Triangles and how we make technical analysis as easy as buy and sell.
|
|||||||||||||||
|
|||||||||||||||
MarketClub’s Trade Triangles for SP400-45102010
![]() The long-term trend has been DOWN since Aug 5th, 2025 at 775.82
The long-term trend has been DOWN since Aug 5th, 2025 at 775.82
![]() The intermediate-term trend has been UP since Apr 6th, 2026 at 383.29
The intermediate-term trend has been UP since Apr 6th, 2026 at 383.29
![]() The short-term trend has been UP since Mar 23rd, 2026 at 364.90
The short-term trend has been UP since Mar 23rd, 2026 at 364.90
Smart Scan Analysis for SP400-45102010
Based on our trend formula, SP400-45102010 is rated as a +60 on a scale from -100 (Strong Downtrend) to +100 (Strong Uptrend).
| Open | High | Low | Price | Change |
|---|---|---|---|---|
| 372.77 | 380.69 | 372.34 | 374.64 | +2.59 |
| Prev. Close | Volume | Bid | Ask | Time |
| 374.64 | 2656378 | 2026-04-07 16:19:35 |
| 52wk High | 738.16 | 52wk High Date | 2018-09-04 |
| 52wk Low | 589.31 | 52wk Low Date | 2018-02-09 |