Index Trend Analysis Report
Prepared for you on Tuesday, March 10, 2026.
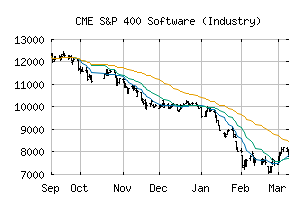
S&P 400 Software (Industry) (CME:SP400-451030)
Sidelines Mode (-55) - SP400-451030 is moving in a sideways pattern and is unable to gain momentum in either direction. Beware of choppy movement and consider a sidelines position until a stronger trend is identified.
Is it time to buy, sell, or avoid SP400-451030?
MarketClub looks at technical strength and momentum to determine if the timing is right for SP400-451030.
Learn more about the Trade Triangles and how we make technical analysis as easy as buy and sell.
|
|||||||||||||||
|
|||||||||||||||
MarketClub’s Trade Triangles for SP400-451030
![]() The long-term trend has been DOWN since Nov 4th, 2025 at 10928.13
The long-term trend has been DOWN since Nov 4th, 2025 at 10928.13
![]() The intermediate-term trend has been UP since Mar 5th, 2026 at 8024.22
The intermediate-term trend has been UP since Mar 5th, 2026 at 8024.22
![]() The short-term trend has been DOWN since Mar 10th, 2026 at 7935.46
The short-term trend has been DOWN since Mar 10th, 2026 at 7935.46
Smart Scan Analysis for SP400-451030
Based on our trend formula, SP400-451030 is rated as a -55 on a scale from -100 (Strong Downtrend) to +100 (Strong Uptrend).
| Open | High | Low | Price | Change |
|---|---|---|---|---|
| 8092.10 | 8092.10 | 7787.83 | 7910.11 | -218.21 |
| Prev. Close | Volume | Bid | Ask | Time |
| 8128.32 | 79798584 | 2026-03-10 16:19:54 |
| 52wk High | 6314.28 | 52wk High Date | 2018-09-14 |
| 52wk Low | 4402.77 | 52wk Low Date | 2018-02-09 |