Index Trend Analysis Report
Prepared for you on Friday, February 27, 2026.
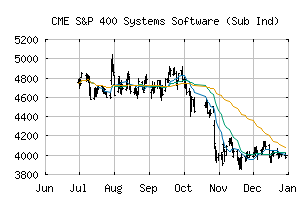
S&P 400 Systems Software (Sub Ind) (CME:SP400-45103020)
Bear Market Rally (-75) - SP400-45103020 is showing some rallying power, but still remains in the confines of a long-term downtrend. Keep an eye on SP400-45103020 as it may be in the beginning of a reversal.
Is it time to buy, sell, or avoid SP400-45103020?
MarketClub looks at technical strength and momentum to determine if the timing is right for SP400-45103020.
Learn more about the Trade Triangles and how we make technical analysis as easy as buy and sell.
|
|||||||||||||||
|
|||||||||||||||
MarketClub’s Trade Triangles for SP400-45103020
![]() The long-term trend has been DOWN since Oct 7th, 2025 at 4572.31
The long-term trend has been DOWN since Oct 7th, 2025 at 4572.31
![]() The intermediate-term trend has been DOWN since Dec 16th, 2025 at 3937.41
The intermediate-term trend has been DOWN since Dec 16th, 2025 at 3937.41
![]() The short-term trend has been UP since Feb 26th, 2026 at 2858.40
The short-term trend has been UP since Feb 26th, 2026 at 2858.40
Smart Scan Analysis for SP400-45103020
Based on our trend formula, SP400-45103020 is rated as a -75 on a scale from -100 (Strong Downtrend) to +100 (Strong Uptrend).
| Open | High | Low | Price | Change |
|---|---|---|---|---|
| 2840.53 | 2893.55 | 2805.95 | 2888.19 | -16.45 |
| Prev. Close | Volume | Bid | Ask | Time |
| 2904.64 | 38094724 | 2026-02-27 15:21:54 |
| 52wk High | 5286.76 | 52wk High Date | 2018-10-01 |
| 52wk Low | 2607.27 | 52wk Low Date | 2017-12-01 |