Index Trend Analysis Report
Prepared for you on Friday, July 26, 2024.
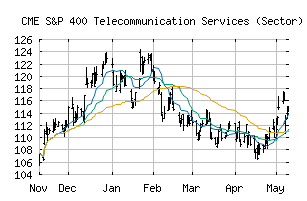
S&P 400 Telecommunication Services (Sector) (CME:SP400-50)
Strong Uptrend (+100) - SP400-50 is in a strong uptrend that is likely to continue. With short-term, intermediate, and long-term bullish momentum, SP400-50 continues to climb. Traders should protect gains and look for a change in score to suggest a slow down in momentum.
Is it time to buy, sell, or avoid SP400-50?
MarketClub looks at technical strength and momentum to determine if the timing is right for SP400-50.
Learn more about the Trade Triangles and how we make technical analysis as easy as buy and sell.
|
|||||||||||||||
|
|||||||||||||||
MarketClub’s Trade Triangles for SP400-50
![]() The long-term trend has been UP since Jun 3rd, 2024 at 118.59
The long-term trend has been UP since Jun 3rd, 2024 at 118.59
![]() The intermediate-term trend has been UP since Jul 1st, 2024 at 115.96
The intermediate-term trend has been UP since Jul 1st, 2024 at 115.96
![]() The short-term trend has been UP since Jul 24th, 2024 at 119.37
The short-term trend has been UP since Jul 24th, 2024 at 119.37
Smart Scan Analysis for SP400-50
Based on our trend formula, SP400-50 is rated as a +100 on a scale from -100 (Strong Downtrend) to +100 (Strong Uptrend).
| Open | High | Low | Price | Change |
|---|---|---|---|---|
| 118.84 | 119.39 | 118.31 | 119.20 | +2.02 |
| Prev. Close | Volume | Bid | Ask | Time |
| 117.18 | 10867142 | 2024-07-26 16:19:54 |
| 52wk High | 167.75 | 52wk High Date | 2018-11-07 |
| 52wk Low | 125.16 | 52wk Low Date | 2018-02-09 |