Index Trend Analysis Report
Prepared for you on Saturday, May 31, 2025.
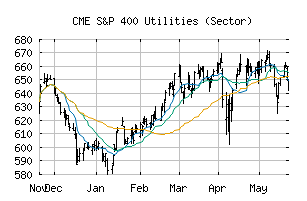
S&P 400 Utilities (Sector) (CME:SP400-55)
Bull Market Weakness (+75) - SP400-55 is showing signs of short-term weakness, but still remains in the confines of a long-term uptrend. Keep an eye on SP400-55 as it may be in the beginning stages of a reversal.
Is it time to buy, sell, or avoid SP400-55?
MarketClub looks at technical strength and momentum to determine if the timing is right for SP400-55.
Learn more about the Trade Triangles and how we make technical analysis as easy as buy and sell.
|
|||||||||||||||
|
|||||||||||||||
MarketClub’s Trade Triangles for SP400-55
![]() The long-term trend has been UP since Mar 3rd, 2025 at 654.53
The long-term trend has been UP since Mar 3rd, 2025 at 654.53
![]() The intermediate-term trend has been DOWN since May 12th, 2025 at 645.79
The intermediate-term trend has been DOWN since May 12th, 2025 at 645.79
![]() The short-term trend has been UP since May 27th, 2025 at 659.10
The short-term trend has been UP since May 27th, 2025 at 659.10
Smart Scan Analysis for SP400-55
Based on our trend formula, SP400-55 is rated as a +75 on a scale from -100 (Strong Downtrend) to +100 (Strong Uptrend).
| Open | High | Low | Price | Change |
|---|---|---|---|---|
| 654.79 | 659.42 | 653.74 | 658.23 | +2.75 |
| Prev. Close | Volume | Bid | Ask | Time |
| 658.23 | 15395143 | 2025-05-30 16:19:59 |
| 52wk High | 581.57 | 52wk High Date | 2018-11-20 |
| 52wk Low | 469.88 | 52wk Low Date | 2018-02-06 |