Index Trend Analysis Report
Prepared for you on Tuesday, March 3, 2026.
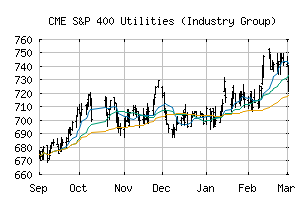
S&P 400 Utilities (Industry Group) (CME:SP400-5510)
Countertrend Up (+85) - SP400-5510 is showing short-term weakness. However, look for the longer-term bullish trend to resume. As always, continue to monitor the trend score and utilize a stop order.
Is it time to buy, sell, or avoid SP400-5510?
MarketClub looks at technical strength and momentum to determine if the timing is right for SP400-5510.
Learn more about the Trade Triangles and how we make technical analysis as easy as buy and sell.
|
|||||||||||||||
|
|||||||||||||||
MarketClub’s Trade Triangles for SP400-5510
![]() The long-term trend has been UP since Mar 3rd, 2025 at 654.46
The long-term trend has been UP since Mar 3rd, 2025 at 654.46
![]() The intermediate-term trend has been UP since Jan 13th, 2026 at 710.70
The intermediate-term trend has been UP since Jan 13th, 2026 at 710.70
![]() The short-term trend has been DOWN since Mar 3rd, 2026 at 740.03
The short-term trend has been DOWN since Mar 3rd, 2026 at 740.03
Smart Scan Analysis for SP400-5510
Based on our trend formula, SP400-5510 is rated as a +85 on a scale from -100 (Strong Downtrend) to +100 (Strong Uptrend).
| Open | High | Low | Price | Change |
|---|---|---|---|---|
| 729.10 | 740.04 | 721.57 | 737.15 | -3.93 |
| Prev. Close | Volume | Bid | Ask | Time |
| 741.08 | 14665163 | 2026-03-03 16:20:09 |
| 52wk High | 581.56 | 52wk High Date | 2018-11-20 |
| 52wk Low | 469.87 | 52wk Low Date | 2018-02-06 |