Index Trend Analysis Report
Prepared for you on Monday, March 23, 2026.
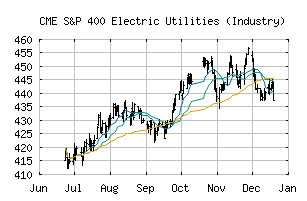
S&P 400 Electric Utilities (Industry) (CME:SP400-551010)
Crossroads (-60) - SP400-551010 is struggling to move into a solid trend. Beware of choppy markets and consider a sidelines position until a stronger trend is identified.
Is it time to buy, sell, or avoid SP400-551010?
MarketClub looks at technical strength and momentum to determine if the timing is right for SP400-551010.
Learn more about the Trade Triangles and how we make technical analysis as easy as buy and sell.
|
|||||||||||||||
|
|||||||||||||||
MarketClub’s Trade Triangles for SP400-551010
![]() The long-term trend has been UP since Feb 4th, 2026 at 456.90
The long-term trend has been UP since Feb 4th, 2026 at 456.90
![]() The intermediate-term trend has been DOWN since Mar 19th, 2026 at 472.19
The intermediate-term trend has been DOWN since Mar 19th, 2026 at 472.19
![]() The short-term trend has been DOWN since Mar 18th, 2026 at 480.72
The short-term trend has been DOWN since Mar 18th, 2026 at 480.72
Smart Scan Analysis for SP400-551010
Based on our trend formula, SP400-551010 is rated as a -60 on a scale from -100 (Strong Downtrend) to +100 (Strong Uptrend).
| Open | High | Low | Price | Change |
|---|---|---|---|---|
| 466.24 | 469.87 | 462.93 | 469.27 | +6.06 |
| Prev. Close | Volume | Bid | Ask | Time |
| 463.21 | 2264152 | 2026-03-23 14:14:35 |
| 52wk High | 440.5 | 52wk High Date | 2018-11-20 |
| 52wk Low | 346.25 | 52wk Low Date | 2018-02-06 |