Index Trend Analysis Report
Prepared for you on Tuesday, July 1, 2025.
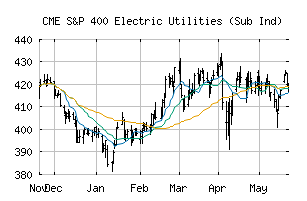
S&P 400 Electric Utilities (Sub Ind) (CME:SP400-55101010)
Bull Market Weakness (+75) - SP400-55101010 is showing signs of short-term weakness, but still remains in the confines of a long-term uptrend. Keep an eye on SP400-55101010 as it may be in the beginning stages of a reversal.
Is it time to buy, sell, or avoid SP400-55101010?
MarketClub looks at technical strength and momentum to determine if the timing is right for SP400-55101010.
Learn more about the Trade Triangles and how we make technical analysis as easy as buy and sell.
|
|||||||||||||||
|
|||||||||||||||
MarketClub’s Trade Triangles for SP400-55101010
![]() The long-term trend has been UP since Feb 24th, 2025 at 424.57
The long-term trend has been UP since Feb 24th, 2025 at 424.57
![]() The intermediate-term trend has been DOWN since Jun 9th, 2025 at 416.14
The intermediate-term trend has been DOWN since Jun 9th, 2025 at 416.14
![]() The short-term trend has been UP since Jul 1st, 2025 at 417.67
The short-term trend has been UP since Jul 1st, 2025 at 417.67
Smart Scan Analysis for SP400-55101010
Based on our trend formula, SP400-55101010 is rated as a +75 on a scale from -100 (Strong Downtrend) to +100 (Strong Uptrend).
| Open | High | Low | Price | Change |
|---|---|---|---|---|
| 417.27 | 419.10 | 415.50 | 418.68 | +1.21 |
| Prev. Close | Volume | Bid | Ask | Time |
| 417.47 | 783293 | 2025-07-01 10:48:05 |
| 52wk High | 440.5 | 52wk High Date | 2018-11-20 |
| 52wk Low | 346.25 | 52wk Low Date | 2018-02-06 |