Index Trend Analysis Report
Prepared for you on Saturday, March 28, 2026.
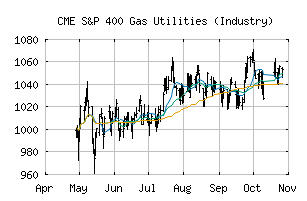
S&P 400 Gas Utilities (Industry) (CME:SP400-551020)
Long-Term Uptrend (+90) - SP400-551020 is in a strong uptrend that is likely to continue. While SP400-551020 is showing intraday weakness, it remains in the confines of a bullish trend. Traders should use caution and utilize a stop order.
Is it time to buy, sell, or avoid SP400-551020?
MarketClub looks at technical strength and momentum to determine if the timing is right for SP400-551020.
Learn more about the Trade Triangles and how we make technical analysis as easy as buy and sell.
|
|||||||||||||||
|
|||||||||||||||
MarketClub’s Trade Triangles for SP400-551020
![]() The long-term trend has been UP since Nov 21st, 2025 at 1071.04
The long-term trend has been UP since Nov 21st, 2025 at 1071.04
![]() The intermediate-term trend has been UP since Jan 15th, 2026 at 1071.17
The intermediate-term trend has been UP since Jan 15th, 2026 at 1071.17
![]() The short-term trend has been UP since Mar 24th, 2026 at 1155.64
The short-term trend has been UP since Mar 24th, 2026 at 1155.64
Smart Scan Analysis for SP400-551020
Based on our trend formula, SP400-551020 is rated as a +90 on a scale from -100 (Strong Downtrend) to +100 (Strong Uptrend).
| Open | High | Low | Price | Change |
|---|---|---|---|---|
| 1154.72 | 1165.71 | 1152.75 | 1154.71 | -0.21 |
| Prev. Close | Volume | Bid | Ask | Time |
| 1154.71 | 3660710 | 2026-03-27 16:34:12 |
| 52wk High | 1136.35 | 52wk High Date | 2018-11-20 |
| 52wk Low | 884.51 | 52wk Low Date | 2018-02-06 |