Index Trend Analysis Report
Prepared for you on Tuesday, July 1, 2025.
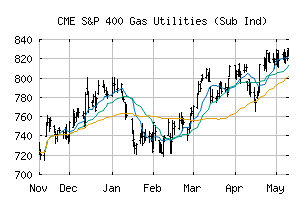
S&P 400 Gas Utilities (Sub Ind) (CME:SP400-55102010)
Countertrend Up (+85) - SP400-55102010 is showing short-term weakness. However, look for the longer-term bullish trend to resume. As always, continue to monitor the trend score and utilize a stop order.
Is it time to buy, sell, or avoid SP400-55102010?
MarketClub looks at technical strength and momentum to determine if the timing is right for SP400-55102010.
Learn more about the Trade Triangles and how we make technical analysis as easy as buy and sell.
|
|||||||||||||||
|
|||||||||||||||
MarketClub’s Trade Triangles for SP400-55102010
![]() The long-term trend has been UP since Jan 2nd, 2024 at 800.14
The long-term trend has been UP since Jan 2nd, 2024 at 800.14
![]() The intermediate-term trend has been UP since Jun 3rd, 2025 at 1021.23
The intermediate-term trend has been UP since Jun 3rd, 2025 at 1021.23
![]() The short-term trend has been DOWN since Jun 25th, 2025 at 1010.95
The short-term trend has been DOWN since Jun 25th, 2025 at 1010.95
Smart Scan Analysis for SP400-55102010
Based on our trend formula, SP400-55102010 is rated as a +85 on a scale from -100 (Strong Downtrend) to +100 (Strong Uptrend).
| Open | High | Low | Price | Change |
|---|---|---|---|---|
| 1009.15 | 1014.80 | 1006.00 | 1014.80 | +2.77 |
| Prev. Close | Volume | Bid | Ask | Time |
| 1014.80 | 4389680 | 2025-06-30 16:19:50 |
| 52wk High | 1136.35 | 52wk High Date | 2018-11-20 |
| 52wk Low | 884.51 | 52wk Low Date | 2018-02-06 |