Index Trend Analysis Report
Prepared for you on Saturday, April 18, 2026.
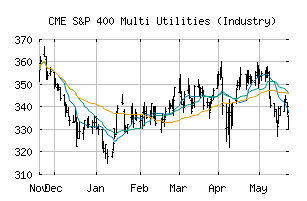
S&P 400 Multi Utilities (Industry) (CME:SP400-551030)
Long-Term Uptrend (+90) - SP400-551030 is in a strong uptrend that is likely to continue. While SP400-551030 is showing intraday weakness, it remains in the confines of a bullish trend. Traders should use caution and utilize a stop order.
Is it time to buy, sell, or avoid SP400-551030?
MarketClub looks at technical strength and momentum to determine if the timing is right for SP400-551030.
Learn more about the Trade Triangles and how we make technical analysis as easy as buy and sell.
|
|||||||||||||||
|
|||||||||||||||
MarketClub’s Trade Triangles for SP400-551030
![]() The long-term trend has been UP since Aug 20th, 2025 at 357.85
The long-term trend has been UP since Aug 20th, 2025 at 357.85
![]() The intermediate-term trend has been UP since Apr 7th, 2026 at 421.58
The intermediate-term trend has been UP since Apr 7th, 2026 at 421.58
![]() The short-term trend has been UP since Apr 15th, 2026 at 448.59
The short-term trend has been UP since Apr 15th, 2026 at 448.59
Smart Scan Analysis for SP400-551030
Based on our trend formula, SP400-551030 is rated as a +90 on a scale from -100 (Strong Downtrend) to +100 (Strong Uptrend).
| Open | High | Low | Price | Change |
|---|---|---|---|---|
| 446.91 | 447.12 | 438.75 | 441.23 | -4.67 |
| Prev. Close | Volume | Bid | Ask | Time |
| 441.23 | 1397855 | 2026-04-17 16:19:54 |
| 52wk High | 387.45 | 52wk High Date | 2018-07-06 |
| 52wk Low | 318.1 | 52wk Low Date | 2018-02-06 |