Index Trend Analysis Report
Prepared for you on Wednesday, April 1, 2026.
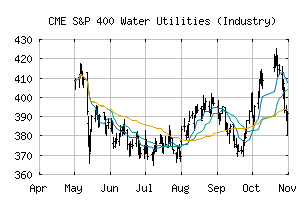
S&P 400 Water Utilities (Industry) (CME:SP400-551040)
Countertrend Up (+85) - SP400-551040 is showing short-term weakness. However, look for the longer-term bullish trend to resume. As always, continue to monitor the trend score and utilize a stop order.
Is it time to buy, sell, or avoid SP400-551040?
MarketClub looks at technical strength and momentum to determine if the timing is right for SP400-551040.
Learn more about the Trade Triangles and how we make technical analysis as easy as buy and sell.
|
|||||||||||||||
|
|||||||||||||||
MarketClub’s Trade Triangles for SP400-551040
![]() The long-term trend has been UP since Feb 27th, 2026 at 407.28
The long-term trend has been UP since Feb 27th, 2026 at 407.28
![]() The intermediate-term trend has been UP since Feb 17th, 2026 at 401.00
The intermediate-term trend has been UP since Feb 17th, 2026 at 401.00
![]() The short-term trend has been UP since Mar 26th, 2026 at 407.73
The short-term trend has been UP since Mar 26th, 2026 at 407.73
Smart Scan Analysis for SP400-551040
Based on our trend formula, SP400-551040 is rated as a +80 on a scale from -100 (Strong Downtrend) to +100 (Strong Uptrend).
| Open | High | Low | Price | Change |
|---|---|---|---|---|
| 412.05 | 413.25 | 400.50 | 404.32 | -7.83 |
| Prev. Close | Volume | Bid | Ask | Time |
| 404.32 | 1781589 | 2026-03-31 16:19:39 |
| 52wk High | 396.79 | 52wk High Date | 2017-12-27 |
| 52wk Low | 322.29 | 52wk Low Date | 2018-11-15 |