Index Trend Analysis Report
Prepared for you on Tuesday, February 3, 2026.
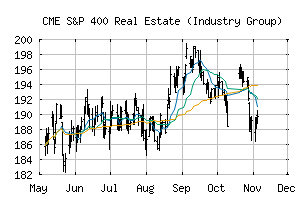
S&P 400 Real Estate (Industry Group) (CME:SP400-6010)
Countertrend Up (+85) - SP400-6010 is showing short-term weakness. However, look for the longer-term bullish trend to resume. As always, continue to monitor the trend score and utilize a stop order.
Is it time to buy, sell, or avoid SP400-6010?
MarketClub looks at technical strength and momentum to determine if the timing is right for SP400-6010.
Learn more about the Trade Triangles and how we make technical analysis as easy as buy and sell.
|
|||||||||||||||
|
|||||||||||||||
MarketClub’s Trade Triangles for SP400-6010
![]() The long-term trend has been UP since Aug 20th, 2025 at 193.32
The long-term trend has been UP since Aug 20th, 2025 at 193.32
![]() The intermediate-term trend has been UP since Jan 8th, 2026 at 192.36
The intermediate-term trend has been UP since Jan 8th, 2026 at 192.36
![]() The short-term trend has been UP since Jan 30th, 2026 at 192.23
The short-term trend has been UP since Jan 30th, 2026 at 192.23
Smart Scan Analysis for SP400-6010
Based on our trend formula, SP400-6010 is rated as a +80 on a scale from -100 (Strong Downtrend) to +100 (Strong Uptrend).
| Open | High | Low | Price | Change |
|---|---|---|---|---|
| 190.39 | 191.89 | 189.91 | 191.57 | +1.21 |
| Prev. Close | Volume | Bid | Ask | Time |
| 190.36 | 57301899 | 2026-02-03 16:19:54 |
| 52wk High | 264.79 | 52wk High Date | 2017-12-06 |
| 52wk Low | 198.32 | 52wk Low Date | 2018-02-12 |