Index Trend Analysis Report
Prepared for you on Saturday, August 30, 2025.
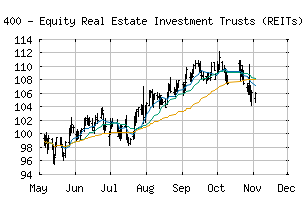
S&P 400 - Equity Real Estate Investment Trusts (REITs) (Industry) (CME:SP400-601010)
Countertrend Up (+85) - SP400-601010 is showing short-term weakness. However, look for the longer-term bullish trend to resume. As always, continue to monitor the trend score and utilize a stop order.
Is it time to buy, sell, or avoid SP400-601010?
MarketClub looks at technical strength and momentum to determine if the timing is right for SP400-601010.
Learn more about the Trade Triangles and how we make technical analysis as easy as buy and sell.
|
|||||||||||||||
|
|||||||||||||||
MarketClub’s Trade Triangles for SP400-601010
![]() The long-term trend has been UP since Feb 13th, 2025 at 93.74
The long-term trend has been UP since Feb 13th, 2025 at 93.74
![]() The intermediate-term trend has been UP since Jul 23rd, 2025 at 102.69
The intermediate-term trend has been UP since Jul 23rd, 2025 at 102.69
![]() The short-term trend has been DOWN since Aug 26th, 2025 at 105.90
The short-term trend has been DOWN since Aug 26th, 2025 at 105.90
Smart Scan Analysis for SP400-601010
Based on our trend formula, SP400-601010 is rated as a +85 on a scale from -100 (Strong Downtrend) to +100 (Strong Uptrend).
| Open | High | Low | Price | Change |
|---|---|---|---|---|
| 107.25 | 107.90 | 106.91 | 107.90 | +1.00 |
| Prev. Close | Volume | Bid | Ask | Time |
| 107.90 | 0 | 2025-08-29 16:19:04 |
| 52wk High | 267.53 | 52wk High Date | 2017-12-06 |
| 52wk Low | 197.85 | 52wk Low Date | 2018-02-12 |