Index Trend Analysis Report
Prepared for you on Wednesday, March 25, 2026.
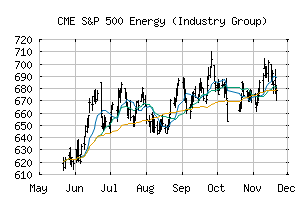
S&P 500 Energy (Industry Group) (CME:SP500-1010)
Long-Term Uptrend (+90) - SP500-1010 is in a strong uptrend that is likely to continue. While SP500-1010 is showing intraday weakness, it remains in the confines of a bullish trend. Traders should use caution and utilize a stop order.
Is it time to buy, sell, or avoid SP500-1010?
MarketClub looks at technical strength and momentum to determine if the timing is right for SP500-1010.
Learn more about the Trade Triangles and how we make technical analysis as easy as buy and sell.
|
|||||||||||||||
|
|||||||||||||||
MarketClub’s Trade Triangles for SP500-1010
![]() The long-term trend has been UP since Aug 29th, 2025 at 685.25
The long-term trend has been UP since Aug 29th, 2025 at 685.25
![]() The intermediate-term trend has been UP since Jan 2nd, 2026 at 702.69
The intermediate-term trend has been UP since Jan 2nd, 2026 at 702.69
![]() The short-term trend has been UP since Mar 24th, 2026 at 920.92
The short-term trend has been UP since Mar 24th, 2026 at 920.92
Smart Scan Analysis for SP500-1010
Based on our trend formula, SP500-1010 is rated as a +90 on a scale from -100 (Strong Downtrend) to +100 (Strong Uptrend).
| Open | High | Low | Price | Change |
|---|---|---|---|---|
| 930.91 | 936.69 | 927.66 | 931.38 | -3.59 |
| Prev. Close | Volume | Bid | Ask | Time |
| 934.97 | 84912562 | 2026-03-25 13:22:53 |
| 52wk High | 583.42 | 52wk High Date | 2018-05-22 |
| 52wk Low | 466.97 | 52wk Low Date | 2018-11-23 |