Index Trend Analysis Report
Prepared for you on Wednesday, July 30, 2025.
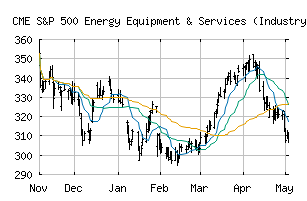
S&P 500 Energy Equipment & Services (Industry) (CME:SP500-101010)
Sidelines Mode (-55) - SP500-101010 is moving in a sideways pattern and is unable to gain momentum in either direction. Beware of choppy movement and consider a sidelines position until a stronger trend is identified.
Is it time to buy, sell, or avoid SP500-101010?
MarketClub looks at technical strength and momentum to determine if the timing is right for SP500-101010.
Learn more about the Trade Triangles and how we make technical analysis as easy as buy and sell.
|
|||||||||||||||
|
|||||||||||||||
MarketClub’s Trade Triangles for SP500-101010
![]() The long-term trend has been DOWN since Jun 3rd, 2024 at 300.44
The long-term trend has been DOWN since Jun 3rd, 2024 at 300.44
![]() The intermediate-term trend has been UP since May 12th, 2025 at 252.23
The intermediate-term trend has been UP since May 12th, 2025 at 252.23
![]() The short-term trend has been DOWN since Jul 30th, 2025 at 269.62
The short-term trend has been DOWN since Jul 30th, 2025 at 269.62
Smart Scan Analysis for SP500-101010
Based on our trend formula, SP500-101010 is rated as a -55 on a scale from -100 (Strong Downtrend) to +100 (Strong Uptrend).
| Open | High | Low | Price | Change |
|---|---|---|---|---|
| 272.26 | 273.16 | 264.90 | 265.34 | -8.40 |
| Prev. Close | Volume | Bid | Ask | Time |
| 273.74 | 32046428 | 2025-07-30 15:10:23 |
| 52wk High | 503.71 | 52wk High Date | 2018-01-23 |
| 52wk Low | 300.53 | 52wk Low Date | 2018-11-28 |