Index Trend Analysis Report
Prepared for you on Sunday, April 5, 2026.
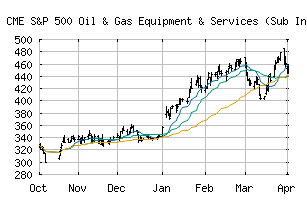
S&P 500 Oil & Gas Equipment & Services (Sub Ind) (CME:SP500-10101020)
Countertrend Up (+85) - SP500-10101020 is showing short-term weakness. However, look for the longer-term bullish trend to resume. As always, continue to monitor the trend score and utilize a stop order.
Is it time to buy, sell, or avoid SP500-10101020?
MarketClub looks at technical strength and momentum to determine if the timing is right for SP500-10101020.
Learn more about the Trade Triangles and how we make technical analysis as easy as buy and sell.
|
|||||||||||||||
|
|||||||||||||||
MarketClub’s Trade Triangles for SP500-10101020
![]() The long-term trend has been UP since Aug 29th, 2025 at 323.94
The long-term trend has been UP since Aug 29th, 2025 at 323.94
![]() The intermediate-term trend has been UP since Mar 26th, 2026 at 470.99
The intermediate-term trend has been UP since Mar 26th, 2026 at 470.99
![]() The short-term trend has been DOWN since Mar 30th, 2026 at 462.20
The short-term trend has been DOWN since Mar 30th, 2026 at 462.20
Smart Scan Analysis for SP500-10101020
Based on our trend formula, SP500-10101020 is rated as a +85 on a scale from -100 (Strong Downtrend) to +100 (Strong Uptrend).
| Open | High | Low | Price | Change |
|---|---|---|---|---|
| 455.05 | 460.07 | 444.82 | 448.95 | -1.90 |
| Prev. Close | Volume | Bid | Ask | Time |
| 448.95 | 35439674 | 2026-04-02 16:19:08 |
| 52wk High | 589.43 | 52wk High Date | 2018-01-23 |
| 52wk Low | 346.61 | 52wk Low Date | 2018-11-28 |