Index Trend Analysis Report
Prepared for you on Friday, January 23, 2026.
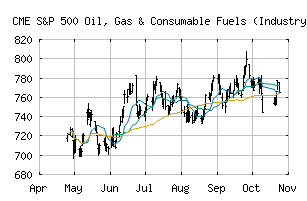
S&P 500 Oil, Gas & Consumable Fuels (Industry) (CME:SP500-101020)
Long-Term Uptrend (+90) - SP500-101020 is in a strong uptrend that is likely to continue. While SP500-101020 is showing intraday weakness, it remains in the confines of a bullish trend. Traders should use caution and utilize a stop order.
Is it time to buy, sell, or avoid SP500-101020?
MarketClub looks at technical strength and momentum to determine if the timing is right for SP500-101020.
Learn more about the Trade Triangles and how we make technical analysis as easy as buy and sell.
|
|||||||||||||||
|
|||||||||||||||
MarketClub’s Trade Triangles for SP500-101020
![]() The long-term trend has been UP since Aug 29th, 2025 at 782.85
The long-term trend has been UP since Aug 29th, 2025 at 782.85
![]() The intermediate-term trend has been UP since Jan 2nd, 2026 at 794.02
The intermediate-term trend has been UP since Jan 2nd, 2026 at 794.02
![]() The short-term trend has been UP since Dec 29th, 2025 at 775.22
The short-term trend has been UP since Dec 29th, 2025 at 775.22
Smart Scan Analysis for SP500-101020
Based on our trend formula, SP500-101020 is rated as a +90 on a scale from -100 (Strong Downtrend) to +100 (Strong Uptrend).
| Open | High | Low | Price | Change |
|---|---|---|---|---|
| 851.95 | 857.04 | 849.06 | 850.20 | +7.73 |
| Prev. Close | Volume | Bid | Ask | Time |
| 842.47 | 66227277 | 2026-01-23 14:00:23 |
| 52wk High | 622.61 | 52wk High Date | 2018-10-09 |
| 52wk Low | 498.8 | 52wk Low Date | 2018-02-09 |