Index Trend Analysis Report
Prepared for you on Friday, May 9, 2025.
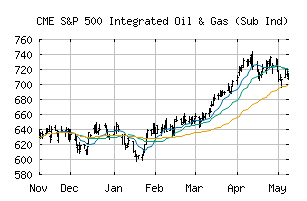
S&P 500 Integrated Oil & Gas (Sub Ind) (CME:SP500-10102010)
Weak Downtrend (-65) - SP500-10102010 is showing signs of a strengthening downtrend. Monitor SP500-10102010 as it may be building momentum to the downside.
Is it time to buy, sell, or avoid SP500-10102010?
MarketClub looks at technical strength and momentum to determine if the timing is right for SP500-10102010.
Learn more about the Trade Triangles and how we make technical analysis as easy as buy and sell.
|
|||||||||||||||
|
|||||||||||||||
MarketClub’s Trade Triangles for SP500-10102010
![]() The long-term trend has been DOWN since Apr 4th, 2025 at 631.76
The long-term trend has been DOWN since Apr 4th, 2025 at 631.76
![]() The intermediate-term trend has been DOWN since Apr 4th, 2025 at 653.86
The intermediate-term trend has been DOWN since Apr 4th, 2025 at 653.86
![]() The short-term trend has been UP since May 8th, 2025 at 620.82
The short-term trend has been UP since May 8th, 2025 at 620.82
Smart Scan Analysis for SP500-10102010
Based on our trend formula, SP500-10102010 is rated as a -65 on a scale from -100 (Strong Downtrend) to +100 (Strong Uptrend).
| Open | High | Low | Price | Change |
|---|---|---|---|---|
| 618.96 | 630.78 | 618.96 | 623.02 | +8.74 |
| Prev. Close | Volume | Bid | Ask | Time |
| 623.02 | 50105062 | 2025-05-08 16:19:08 |
| 52wk High | 576.38 | 52wk High Date | 2018-01-24 |
| 52wk Low | 472.47 | 52wk Low Date | 2018-04-02 |