Index Trend Analysis Report
Prepared for you on Thursday, December 26, 2024.
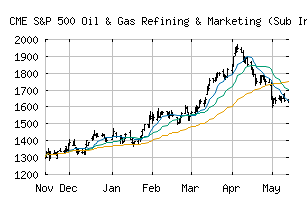
S&P 500 Oil & Gas Refining & Marketing (Sub Ind) (CME:SP500-10102030)
Long-Term Downtrend (-90) - SP500-10102030 is in a strong downtrend that is likely to continue. While SP500-10102030 is showing intraday strength, it remains in the confines of a bearish trend. Traders should use caution and set stops.
Is it time to buy, sell, or avoid SP500-10102030?
MarketClub looks at technical strength and momentum to determine if the timing is right for SP500-10102030.
Learn more about the Trade Triangles and how we make technical analysis as easy as buy and sell.
|
|||||||||||||||
|
|||||||||||||||
MarketClub’s Trade Triangles for SP500-10102030
![]() The long-term trend has been DOWN since Jun 11th, 2024 at 1559.55
The long-term trend has been DOWN since Jun 11th, 2024 at 1559.55
![]() The intermediate-term trend has been DOWN since Dec 4th, 2024 at 1405.80
The intermediate-term trend has been DOWN since Dec 4th, 2024 at 1405.80
![]() The short-term trend has been DOWN since Dec 4th, 2024 at 1437.59
The short-term trend has been DOWN since Dec 4th, 2024 at 1437.59
Smart Scan Analysis for SP500-10102030
Based on our trend formula, SP500-10102030 is rated as a -90 on a scale from -100 (Strong Downtrend) to +100 (Strong Uptrend).
| Open | High | Low | Price | Change |
|---|---|---|---|---|
| 1231.57 | 1246.00 | 1224.24 | 1244.41 | +9.34 |
| Prev. Close | Volume | Bid | Ask | Time |
| 1244.41 | 4011298 | 2024-12-24 13:19:53 |
| 52wk High | 1114.05 | 52wk High Date | 2018-06-04 |
| 52wk Low | 781.45 | 52wk Low Date | 2018-11-23 |