Index Trend Analysis Report
Prepared for you on Wednesday, April 24, 2024.
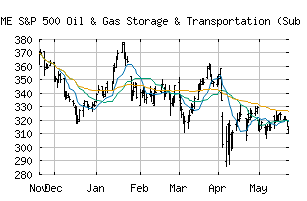
S&P 500 Oil & Gas Storage & Transportation (Sub Ind) (CME:SP500-10102040)
Bull Market Weakness (+75) - SP500-10102040 is showing signs of short-term weakness, but still remains in the confines of a long-term uptrend. Keep an eye on SP500-10102040 as it may be in the beginning stages of a reversal.
Is it time to buy, sell, or avoid SP500-10102040?
MarketClub looks at technical strength and momentum to determine if the timing is right for SP500-10102040.
Learn more about the Trade Triangles and how we make technical analysis as easy as buy and sell.
|
|||||||||||||||
|
|||||||||||||||
MarketClub’s Trade Triangles for SP500-10102040
![]() The long-term trend has been UP since Oct 13th, 2023 at 206.89
The long-term trend has been UP since Oct 13th, 2023 at 206.89
![]() The intermediate-term trend has been DOWN since Apr 15th, 2024 at 231.07
The intermediate-term trend has been DOWN since Apr 15th, 2024 at 231.07
![]() The short-term trend has been UP since Apr 19th, 2024 at 232.05
The short-term trend has been UP since Apr 19th, 2024 at 232.05
Smart Scan Analysis for SP500-10102040
Based on our trend formula, SP500-10102040 is rated as a +75 on a scale from -100 (Strong Downtrend) to +100 (Strong Uptrend).
| Open | High | Low | Price | Change |
|---|---|---|---|---|
| 236.70 | 239.36 | 235.82 | 238.92 | +0.69 |
| Prev. Close | Volume | Bid | Ask | Time |
| 238.23 | 3148290 | 2024-04-24 10:41:53 |
| 52wk High | 198.93 | 52wk High Date | 2018-01-16 |
| 52wk Low | 156.24 | 52wk Low Date | 2018-04-03 |