Index Trend Analysis Report
Prepared for you on Friday, April 17, 2026.
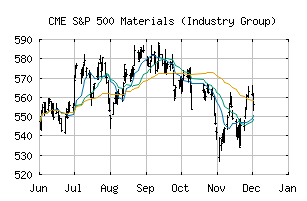
S&P 500 Materials (Industry Group) (CME:SP500-1510)
Countertrend Up (+85) - SP500-1510 is showing short-term weakness. However, look for the longer-term bullish trend to resume. As always, continue to monitor the trend score and utilize a stop order.
Is it time to buy, sell, or avoid SP500-1510?
MarketClub looks at technical strength and momentum to determine if the timing is right for SP500-1510.
Learn more about the Trade Triangles and how we make technical analysis as easy as buy and sell.
|
|||||||||||||||
|
|||||||||||||||
MarketClub’s Trade Triangles for SP500-1510
![]() The long-term trend has been UP since Jan 5th, 2026 at 585.23
The long-term trend has been UP since Jan 5th, 2026 at 585.23
![]() The intermediate-term trend has been UP since Apr 1st, 2026 at 635.17
The intermediate-term trend has been UP since Apr 1st, 2026 at 635.17
![]() The short-term trend has been DOWN since Apr 15th, 2026 at 652.12
The short-term trend has been DOWN since Apr 15th, 2026 at 652.12
Smart Scan Analysis for SP500-1510
Based on our trend formula, SP500-1510 is rated as a +85 on a scale from -100 (Strong Downtrend) to +100 (Strong Uptrend).
| Open | High | Low | Price | Change |
|---|---|---|---|---|
| 649.78 | 654.59 | 649.32 | 651.66 | +3.53 |
| Prev. Close | Volume | Bid | Ask | Time |
| 651.66 | 94676161 | 2026-04-16 16:18:38 |
| 52wk High | 402.07 | 52wk High Date | 2018-01-26 |
| 52wk Low | 302.06 | 52wk Low Date | 2017-12-06 |