Index Trend Analysis Report
Prepared for you on Monday, March 30, 2026.
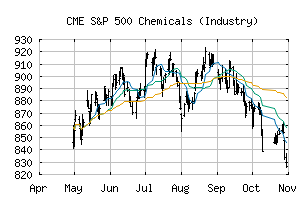
S&P 500 Chemicals (Industry) (CME:SP500-151010)
Weak Uptrend (+65) - SP500-151010 is showing signs of weakening momentum to the upside. Monitor SP500-151010 as it may be in the beginning stages of a reversal.
Is it time to buy, sell, or avoid SP500-151010?
MarketClub looks at technical strength and momentum to determine if the timing is right for SP500-151010.
Learn more about the Trade Triangles and how we make technical analysis as easy as buy and sell.
|
|||||||||||||||
|
|||||||||||||||
MarketClub’s Trade Triangles for SP500-151010
![]() The long-term trend has been UP since Jan 8th, 2026 at 878.32
The long-term trend has been UP since Jan 8th, 2026 at 878.32
![]() The intermediate-term trend has been DOWN since Mar 9th, 2026 at 935.46
The intermediate-term trend has been DOWN since Mar 9th, 2026 at 935.46
![]() The short-term trend has been UP since Mar 24th, 2026 at 947.35
The short-term trend has been UP since Mar 24th, 2026 at 947.35
Smart Scan Analysis for SP500-151010
Based on our trend formula, SP500-151010 is rated as a +65 on a scale from -100 (Strong Downtrend) to +100 (Strong Uptrend).
| Open | High | Low | Price | Change |
|---|---|---|---|---|
| 970.56 | 972.93 | 963.86 | 966.34 | -3.38 |
| Prev. Close | Volume | Bid | Ask | Time |
| 966.34 | 52056473 | 2026-03-27 16:31:12 |
| 52wk High | 664.66 | 52wk High Date | 2018-01-26 |
| 52wk Low | 541.58 | 52wk Low Date | 2018-10-26 |