Index Trend Analysis Report
Prepared for you on Tuesday, April 14, 2026.
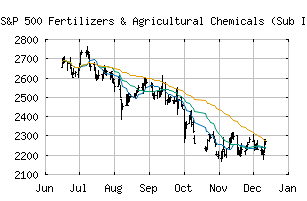
S&P 500 Fertilizers & Agricultural Chemicals (Sub Industry) (CME:SP500-15101030)
Weak Uptrend (+65) - SP500-15101030 is showing signs of weakening momentum to the upside. Monitor SP500-15101030 as it may be in the beginning stages of a reversal.
Is it time to buy, sell, or avoid SP500-15101030?
MarketClub looks at technical strength and momentum to determine if the timing is right for SP500-15101030.
Learn more about the Trade Triangles and how we make technical analysis as easy as buy and sell.
|
|||||||||||||||
|
|||||||||||||||
MarketClub’s Trade Triangles for SP500-15101030
![]() The long-term trend has been UP since Jan 14th, 2026 at 2437.86
The long-term trend has been UP since Jan 14th, 2026 at 2437.86
![]() The intermediate-term trend has been UP since Dec 30th, 2025 at 2281.50
The intermediate-term trend has been UP since Dec 30th, 2025 at 2281.50
![]() The short-term trend has been DOWN since Apr 8th, 2026 at 2955.04
The short-term trend has been DOWN since Apr 8th, 2026 at 2955.04
Smart Scan Analysis for SP500-15101030
Based on our trend formula, SP500-15101030 is rated as a +65 on a scale from -100 (Strong Downtrend) to +100 (Strong Uptrend).
| Open | High | Low | Price | Change |
|---|---|---|---|---|
| 2882.70 | 2895.16 | 2839.21 | 2854.94 | -34.54 |
| Prev. Close | Volume | Bid | Ask | Time |
| 2889.48 | 17415138 | 2026-04-14 16:17:23 |
| 52wk High | 1626.81 | 52wk High Date | 2018-10-04 |
| 52wk Low | 1231.19 | 52wk Low Date | 2018-04-04 |