Index Trend Analysis Report
Prepared for you on Friday, April 19, 2024.
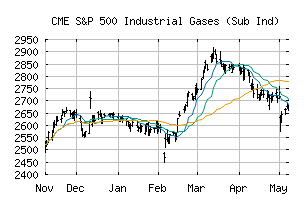
S&P 500 Industrial Gases (Sub Ind) (CME:SP500-15101040)
Weak Downtrend (-65) - SP500-15101040 is showing signs of a strengthening downtrend. Monitor SP500-15101040 as it may be building momentum to the downside.
Is it time to buy, sell, or avoid SP500-15101040?
MarketClub looks at technical strength and momentum to determine if the timing is right for SP500-15101040.
Learn more about the Trade Triangles and how we make technical analysis as easy as buy and sell.
|
|||||||||||||||
|
|||||||||||||||
MarketClub’s Trade Triangles for SP500-15101040
![]() The long-term trend has been UP since Feb 23rd, 2024 at 2737.34
The long-term trend has been UP since Feb 23rd, 2024 at 2737.34
![]() The intermediate-term trend has been DOWN since Apr 2nd, 2024 at 2812.08
The intermediate-term trend has been DOWN since Apr 2nd, 2024 at 2812.08
![]() The short-term trend has been DOWN since Apr 2nd, 2024 at 2815.57
The short-term trend has been DOWN since Apr 2nd, 2024 at 2815.57
Smart Scan Analysis for SP500-15101040
Based on our trend formula, SP500-15101040 is rated as a -70 on a scale from -100 (Strong Downtrend) to +100 (Strong Uptrend).
| Open | High | Low | Price | Change |
|---|---|---|---|---|
| 2743.35 | 2744.74 | 2712.87 | 2723.92 | -3.76 |
| Prev. Close | Volume | Bid | Ask | Time |
| 2727.68 | 3472045 | 2024-04-19 16:20:08 |
| 52wk High | 1235.12 | 52wk High Date | 2018-01-25 |
| 52wk Low | 1065.64 | 52wk Low Date | 2018-04-02 |