Index Trend Analysis Report
Prepared for you on Wednesday, April 8, 2026.
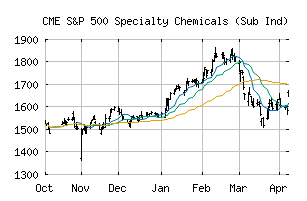
S&P 500 Specialty Chemicals (Sub Ind) (CME:SP500-15101050)
Bull Market Weakness (+75) - SP500-15101050 is showing signs of short-term weakness, but still remains in the confines of a long-term uptrend. Keep an eye on SP500-15101050 as it may be in the beginning stages of a reversal.
Is it time to buy, sell, or avoid SP500-15101050?
MarketClub looks at technical strength and momentum to determine if the timing is right for SP500-15101050.
Learn more about the Trade Triangles and how we make technical analysis as easy as buy and sell.
|
|||||||||||||||
|
|||||||||||||||
MarketClub’s Trade Triangles for SP500-15101050
![]() The long-term trend has been DOWN since Mar 20th, 2026 at 1511.09
The long-term trend has been DOWN since Mar 20th, 2026 at 1511.09
![]() The intermediate-term trend has been UP since Apr 8th, 2026 at 1658.54
The intermediate-term trend has been UP since Apr 8th, 2026 at 1658.54
![]() The short-term trend has been UP since Apr 8th, 2026 at 1635.52
The short-term trend has been UP since Apr 8th, 2026 at 1635.52
Smart Scan Analysis for SP500-15101050
Based on our trend formula, SP500-15101050 is rated as a +70 on a scale from -100 (Strong Downtrend) to +100 (Strong Uptrend).
| Open | High | Low | Price | Change |
|---|---|---|---|---|
| 1663.57 | 1674.00 | 1648.84 | 1673.40 | +87.55 |
| Prev. Close | Volume | Bid | Ask | Time |
| 1585.85 | 13314344 | 2026-04-08 16:19:38 |
| 52wk High | 1302.41 | 52wk High Date | 2018-09-21 |
| 52wk Low | 1106.3 | 52wk Low Date | 2018-04-02 |