Index Trend Analysis Report
Prepared for you on Tuesday, March 3, 2026.
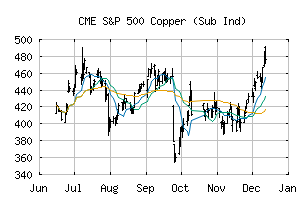
S&P 500 Copper (Sub Ind) (CME:SP500-15104025)
Bull Market Weakness (+75) - SP500-15104025 is showing signs of short-term weakness, but still remains in the confines of a long-term uptrend. Keep an eye on SP500-15104025 as it may be in the beginning stages of a reversal.
Is it time to buy, sell, or avoid SP500-15104025?
MarketClub looks at technical strength and momentum to determine if the timing is right for SP500-15104025.
Learn more about the Trade Triangles and how we make technical analysis as easy as buy and sell.
|
|||||||||||||||
|
|||||||||||||||
MarketClub’s Trade Triangles for SP500-15104025
![]() The long-term trend has been UP since Dec 11th, 2025 at 472.13
The long-term trend has been UP since Dec 11th, 2025 at 472.13
![]() The intermediate-term trend has been UP since Nov 26th, 2025 at 425.05
The intermediate-term trend has been UP since Nov 26th, 2025 at 425.05
![]() The short-term trend has been DOWN since Mar 3rd, 2026 at 662.42
The short-term trend has been DOWN since Mar 3rd, 2026 at 662.42
Smart Scan Analysis for SP500-15104025
Based on our trend formula, SP500-15104025 is rated as a +75 on a scale from -100 (Strong Downtrend) to +100 (Strong Uptrend).
| Open | High | Low | Price | Change |
|---|---|---|---|---|
| 642.35 | 653.32 | 612.47 | 646.48 | -40.54 |
| Prev. Close | Volume | Bid | Ask | Time |
| 687.02 | 14373480 | 2026-03-03 12:05:09 |
| 52wk High | 202.97 | 52wk High Date | 2018-01-22 |
| 52wk Low | 106.54 | 52wk Low Date | 2018-10-24 |