Index Trend Analysis Report
Prepared for you on Wednesday, March 4, 2026.
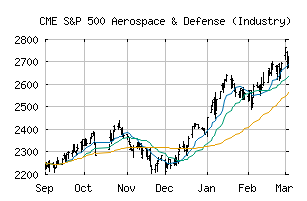
S&P 500 Aerospace & Defense (Industry) (CME:SP500-201010)
Strong Uptrend (+100) - SP500-201010 is in a strong uptrend that is likely to continue. With short-term, intermediate, and long-term bullish momentum, SP500-201010 continues to climb. Traders should protect gains and look for a change in score to suggest a slow down in momentum.
Is it time to buy, sell, or avoid SP500-201010?
MarketClub looks at technical strength and momentum to determine if the timing is right for SP500-201010.
Learn more about the Trade Triangles and how we make technical analysis as easy as buy and sell.
|
|||||||||||||||
|
|||||||||||||||
MarketClub’s Trade Triangles for SP500-201010
![]() The long-term trend has been UP since May 2nd, 2025 at 1884.24
The long-term trend has been UP since May 2nd, 2025 at 1884.24
![]() The intermediate-term trend has been UP since Feb 13th, 2026 at 2639.31
The intermediate-term trend has been UP since Feb 13th, 2026 at 2639.31
![]() The short-term trend has been UP since Feb 27th, 2026 at 2692.36
The short-term trend has been UP since Feb 27th, 2026 at 2692.36
Smart Scan Analysis for SP500-201010
Based on our trend formula, SP500-201010 is rated as a +100 on a scale from -100 (Strong Downtrend) to +100 (Strong Uptrend).
| Open | High | Low | Price | Change |
|---|---|---|---|---|
| 2714.21 | 2725.28 | 2676.83 | 2722.48 | +18.14 |
| Prev. Close | Volume | Bid | Ask | Time |
| 2704.34 | 23640910 | 2026-03-04 16:19:34 |
| 52wk High | 1362.75 | 52wk High Date | 2018-10-03 |
| 52wk Low | 1119.49 | 52wk Low Date | 2018-10-29 |